I have set up a simple test map consisting of a slab of BSP, a
skylight, a playerstart, a skydome, and a directional light.
I will only be using default editor assets which can be found
in the EditorMeshes and EditorMaterials
packages.
There are two basic methods of debugging Kismet which are best
used in tandem.
Comments:
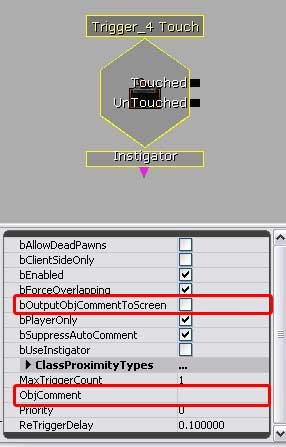
Every single Kismet entity can be commented, and this comment
can be output to the screen as text, in the lower left corner,
at any time. Simply comment the entity and when a signal reaches
it, it will output to the screen if you have the 'bOutputObjCommentToScreen'
checked off, as shown below. This will enable you to track each
entity the signal hits as it hits it, which can tell you where
the signal is breaking down.
|
|
• If Object Comments don't work: (This also goes
for logs) If you follow the instructions and no messages appear
onscreen, your engine may be set to disable these 'debug' messages
in game. To fix this, you may need to try several things.
*Note: The following involves changing .ini files for the games.
This can cause things to go horribly awry in some cases, so
back up the files first.
1) Find your 'DefaultEngine.ini' file. This file will be located
in different places for different Engines/Games. Open it and
do a search for 'Kismet'. One of the first results will be 'bOnScreenKismetWarnings=FALSE'.
You'll need to change this to 'bOnScreenKismetWarnings=TRUE',
save the .ini, and see if it works.
2) If this does not work, after the 'bOnScreenKismetWarnings=FALSE'
line, add this line: 'bEnableKismetLogging=TRUE'.
3) This may work, but is generally not reccomended since it
may very well be a 'cooked' file depending on the game. Look
for the game-specific xxxengine.ini where xxx is the game and
enable the same two settings there.
4) If it still does not work, you'll need to rely only on logs
while in PIE (Play In Editor) mode - not the game itself. Add
logs to the system per the instructions below. However, you'll
only be able to view them in the generic browser's 'Log' tab,
and only if you set the 'bIncludeObjComment' boolean to true.
The text will appear in the generic browser's log, but not on
the screen.
5) If even this does not work, then there's one route left.
Instead of using a log, grab an emitter and place it where you
can see it. Use a Toggle action to turn it on when you would
want the log to go off. Thus, if the emitter goes off, you'll
know that portion is working. Remember to turn off the 'AutoActivate'
property in the emitter.
Logs:
You can hook up a log to almost anything. You can output a signal
to a log, name the log what you're testing in its comment, set
its 'bOutputObjCommentToScreen' to true, and get a message on
screen when the signal hits it. You can also attach them to
references and variables if you're tracking if, for example,
a counter is counting correctly. In the examples below, the
MaxTriggerCount on the trigger is set to 0.
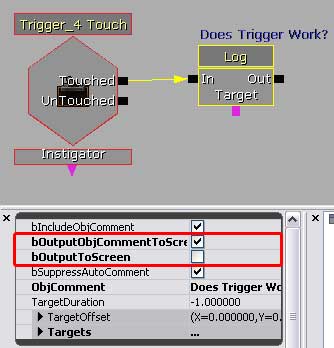
Debugging signal throughput: I've set up a trigger
and a log to verify that the trigger is firing. You could easily
do this by commenting the trigger and telling it to output the
comment to screen as well. I've unchecked 'bOutputToScreen'
in the log, and have checked off 'bOutputObjectCommentToScreen'.
When the trigger fires, the log comment will appear on-screen.
|
|
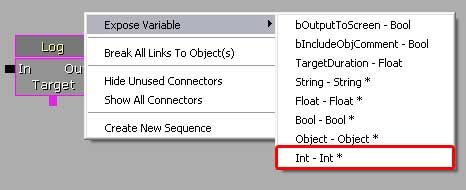
Debugging Variables: I'm going to set up a log that
will record an int's value, and output that whenever the log
is called. First, I have to expose the int ouput on the log.
I do that by right-clicking on the log, and selecting Expose
Variable -> Int - Int*.
|
|
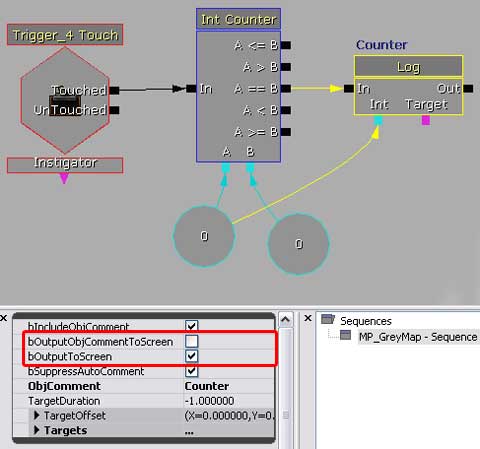
The next step is to hook it into the system. In the screenshot
below, I've created an int counter. I'm going to track the value
of A and the log will tell me what A is whenever A is equal
to b in the counter. I've unchecked 'bOuputObjCommentToScreen'
because I don't need the comment, but I have checked 'bOutputToScreen'
because this will show the int value on screen.
|
|